
Screener Loop Pattern: LLM Analysis at Scale
When you need to analyze thousands of unstructured artifacts (logs, error reports, support tickets) you face a dilemma. Humans are great at understanding individual cases but can’t scale. LLMs can process everything but make mistakes and often lack domain context. The Screener Loop pattern combines both by creating a tight feedback cycle between bulk LLM analysis and targeted human review.
It is a subclass of “have an LLM make adhoc tools for me”.
I am probably not the first person to invent this pattern, but I have found myself coming back to it for several more problems with a lot of success.
The Problem
Out of a couple hundred thousand CI job runs, I had a corpus that I believed were generic “infrastructure” problems, either our own internal build infrastructure or issues in external providers. These are jobs that never reached the point of doing useful work (producing test results). I wanted to screen them and understand where the problems were coming from and if they were our fault, spend time focus on fixing the most common.
Reading 10,000 logs manually? Not happening. Regex pattern matching? Well, I’d have to know what I’m looking for first. Pure LLM classification? A good starting point, but it doesn’t have the expertise I have.
The Pattern
The Screener Loop has five phases, with the feedback loop repeating until the results are good enough.
Phase 1: Bulk LLM Classification
Split the dataset into batches and send each to an LLM subagent in parallel. Each agent reads ~100 logs and returns structured classifications:
{
  "2034253746107584512": {
    "category": "lease failure",
    "snippet": "failed to acquire lease for aws-3-quota-slice"
  }
}
I used 100 parallel subagents to classify all 10,000 logs. The LLM doesn’t need perfect instructions. Give it a rough category list and let it create new categories when it finds something unexpected. This first pass gets you maybe 60-70% accuracy, which sounds bad until you realize it just turned an impossible manual task into a tractable review task.
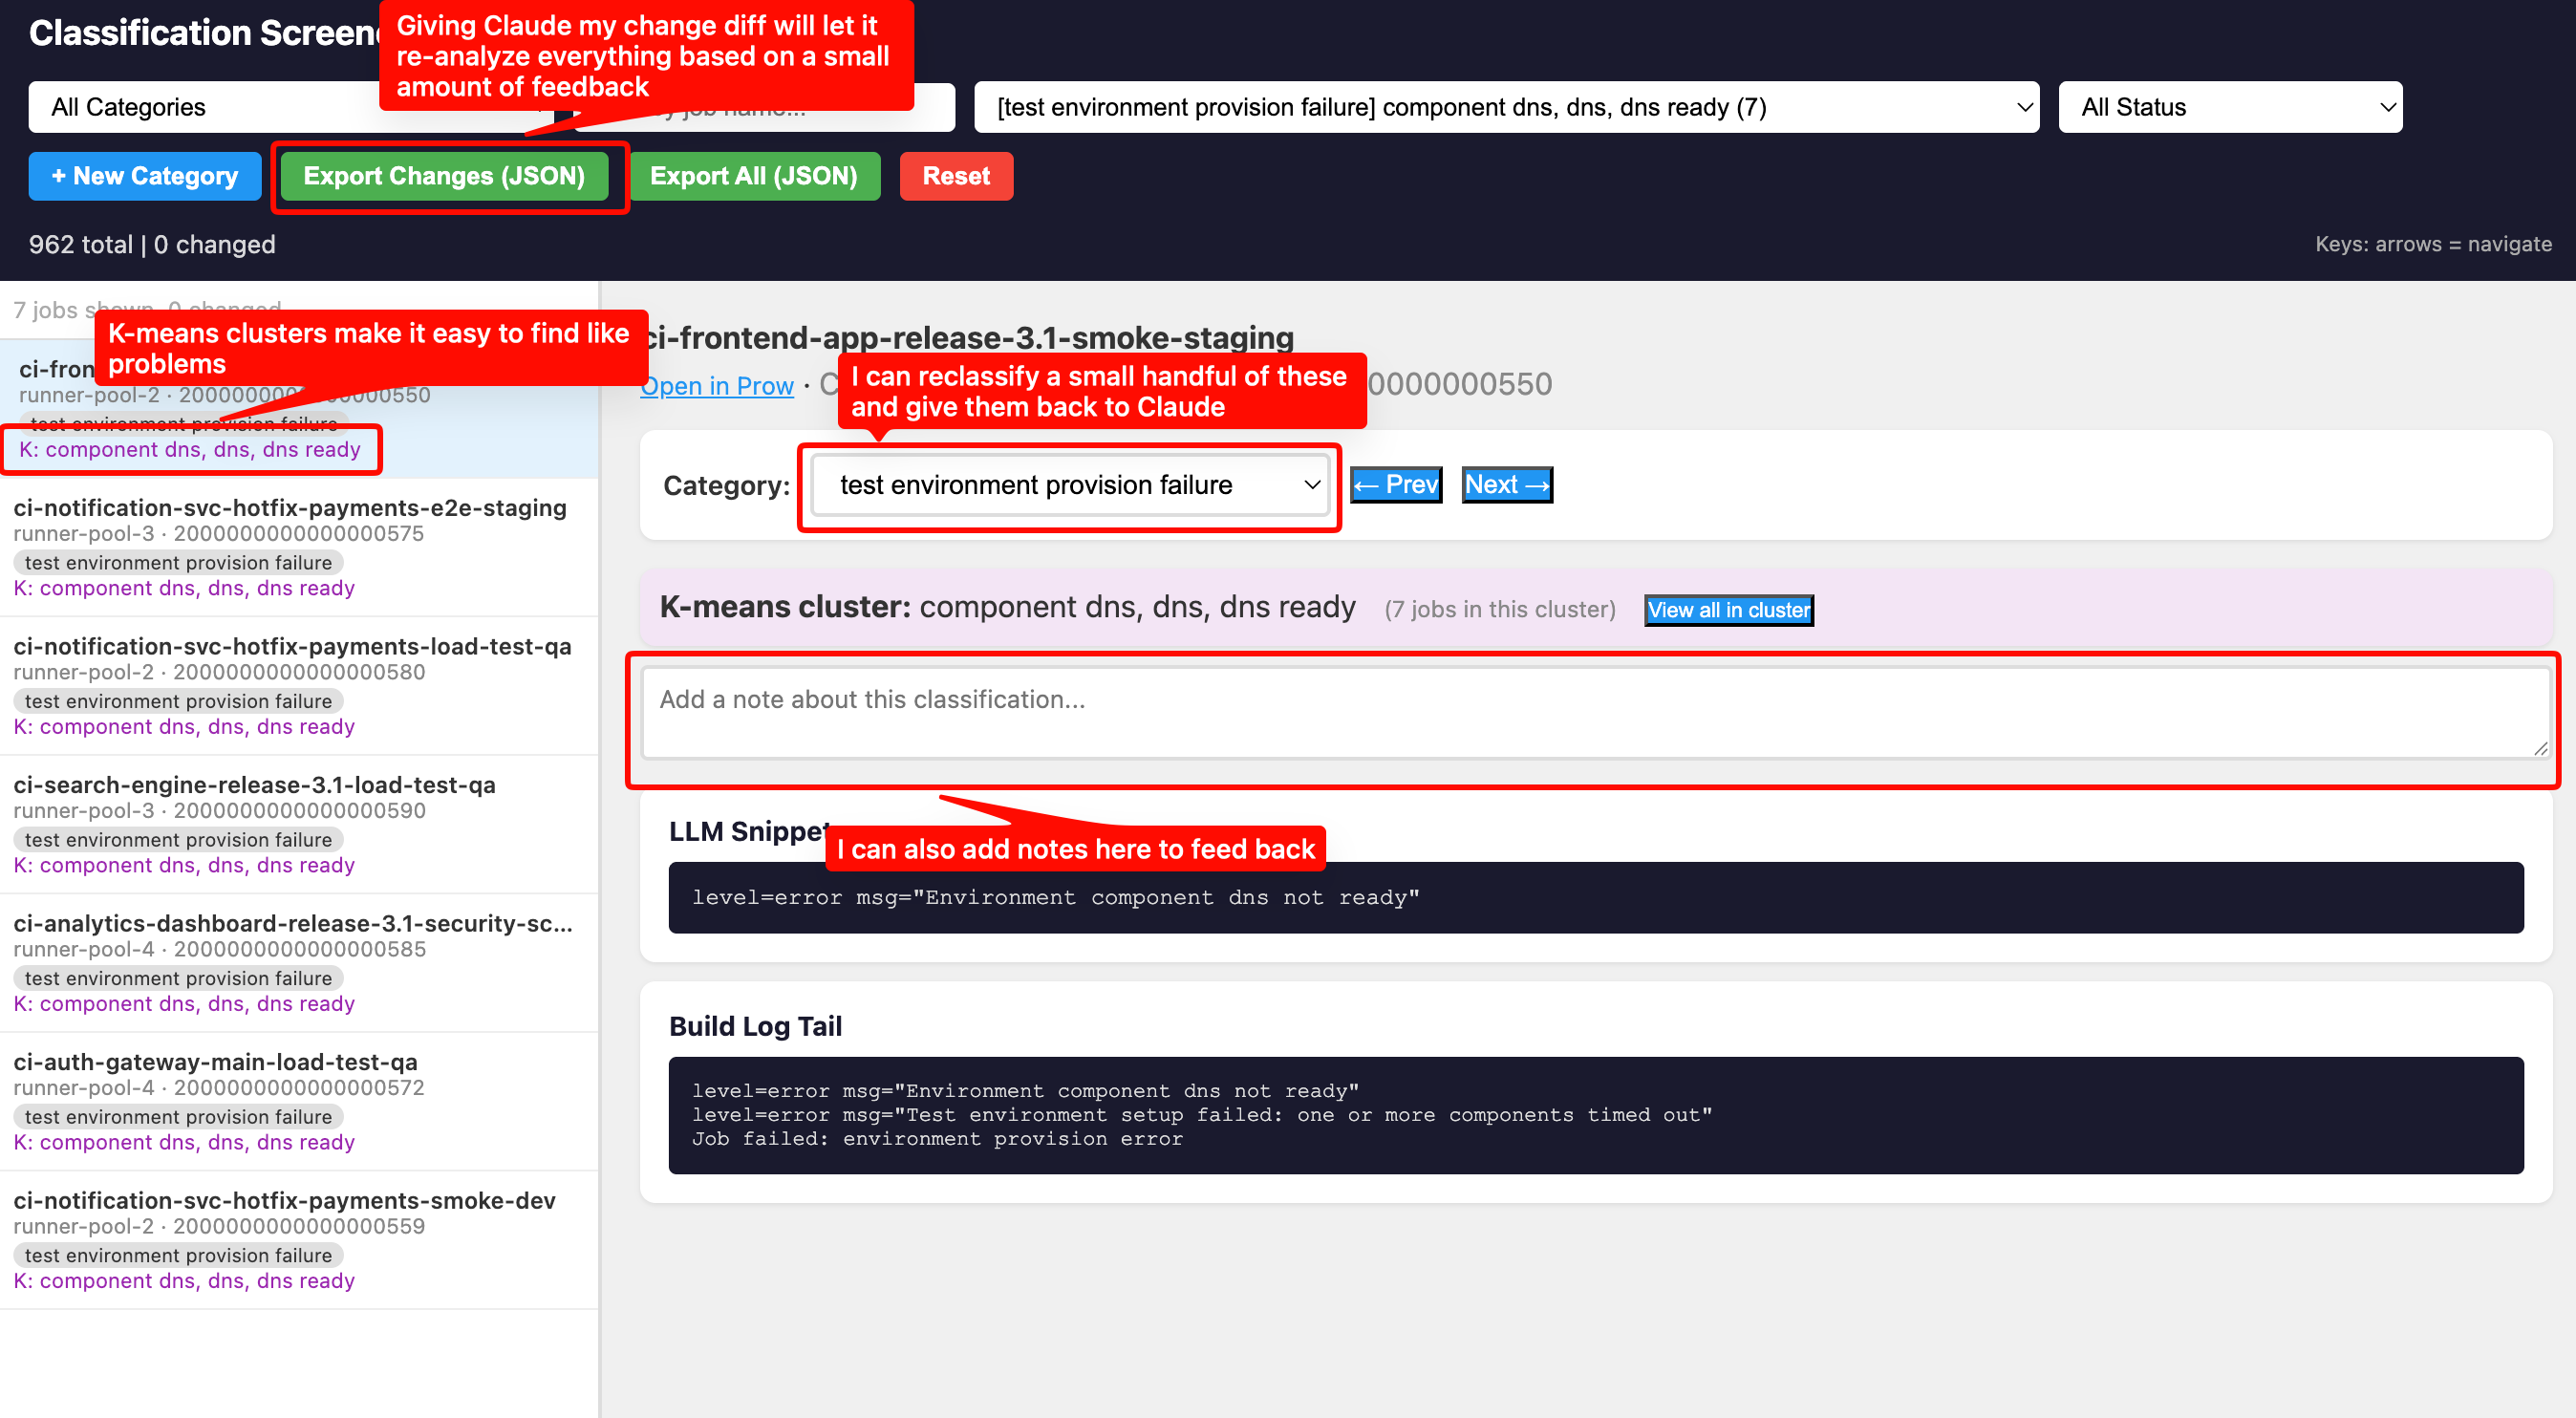
Phase 2: Materialize Results as an Interactive Tool
This is what makes the pattern work. Don’t just dump classifications into a spreadsheet. Instruct the LLM to create a self-contained HTML screener tool that lets the reviewer:
- Browse every classification with the original log right there
- Change categories with a dropdown
- Add freeform notes explaining why something is wrong
- Filter by category, job name, or review status
- See everything persisted in localStorage so they can close the tab and come back
The screener is a single HTML file with all data embedded as JavaScript constants. No server needed, just open it in a browser. The screener tool defaults to a randomized the order, so you are seeing a diversity of data.
Phase 3: Human Review and Correction
The human reviews a sample (maybe 30-50 items) and does two things:
- Recategorizes misclassified items using the dropdown
- Writes notes explaining the pattern they see
The notes are the important part. Instead of just changing a category, the reviewer writes things like:
"'0/121 nodes are available: 23 Insufficient memory, 59
Insufficient cpu', this is a capacity issue on the
build cluster"
"Back-off pulling image '.*stable:test', this is
a missing test container image"
These notes contain the pattern, not just the correction. When exported as JSON, they become instructions for the next phase.
Phase 4: Pattern Generalization
I then give the JSON file back to the LLM in the same session: take the human’s corrections, generalize them, and re-evaluate all other entries.
One human correction often fixed hundreds of items.
Phase 5: Regenerate and Repeat
Regenerate the screener with updated classifications and go back to Phase 3. Each iteration the “unknown” bucket shrinks and the meaningful categories grow. I went from several thousand unknowns to under 500 in three review cycles, with about a dozen distinct categories emerging.
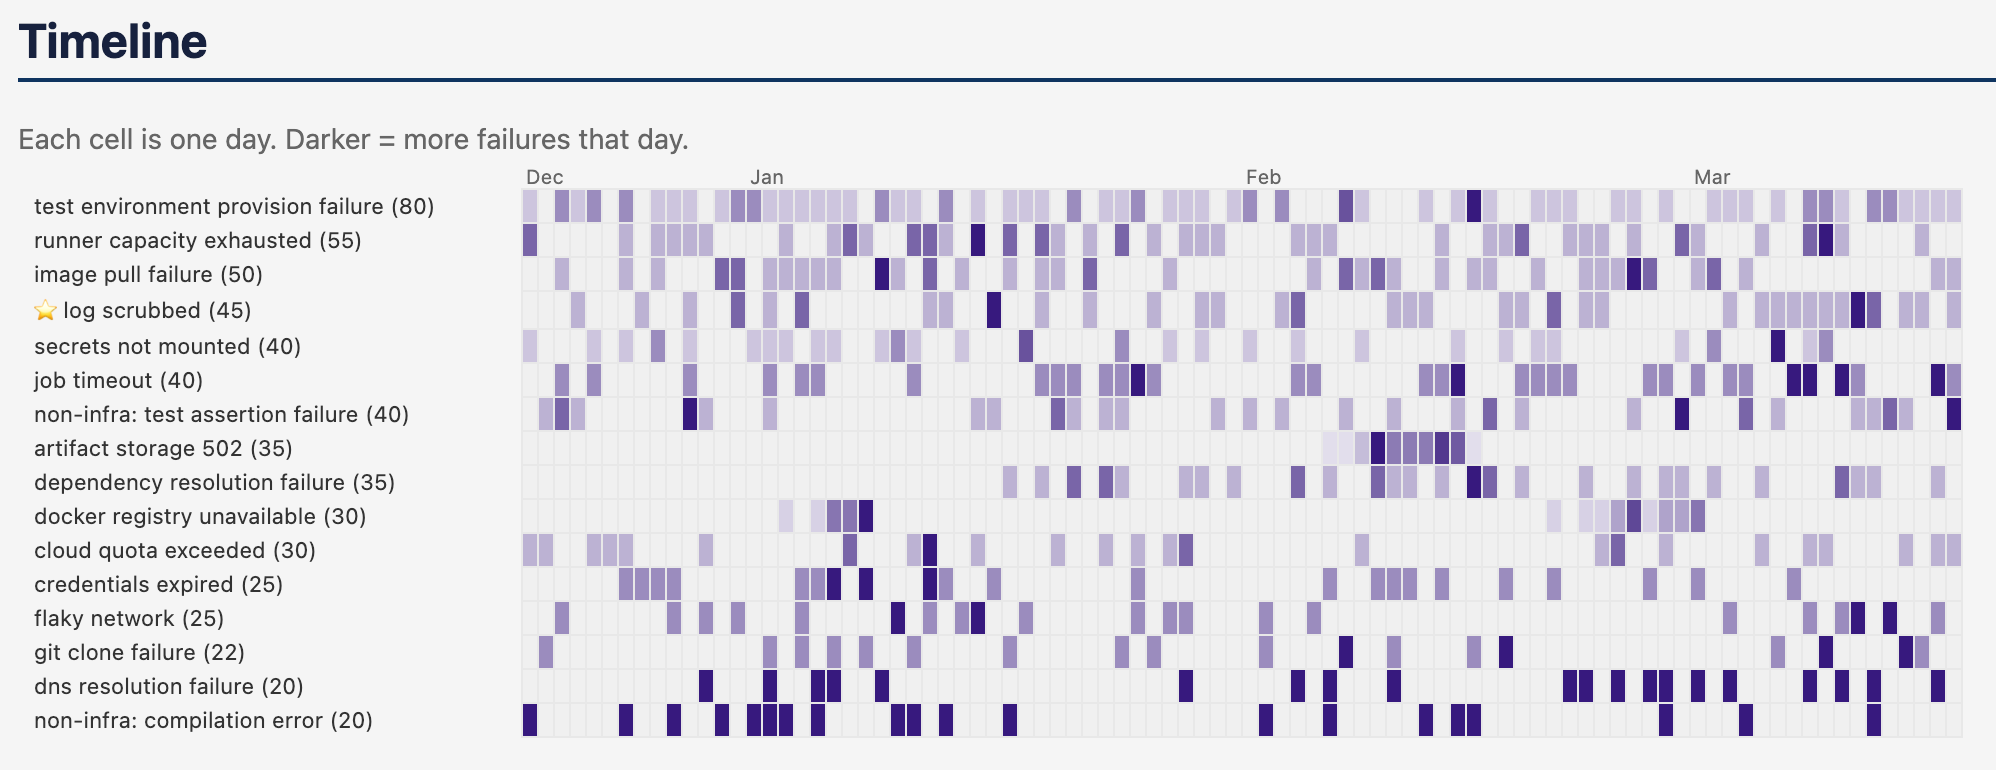
After completing the screener cycle, the LLM can produce a static report - document - markdown, HTML, etc. A reccomendation from a coworker had me introduce a heatmap, which was incredibly useful to pinpoint one-off vs clustered vs perennial problems.
Augmenting with K-Means Clustering
After the first few review cycles, I still had thousands of “unknown” logs. Reviewing them one by one was slow. I needed a way to find structure in the unknowns, without spending a ton of money on LLM tokens.
TF-IDF vectorization + K-means clustering turned out to be the right tool. I only have a vague idea of what this means, I did poorly in my undergrad stats course. I might be wildly misapplying the concepts, but it did work quite well.
This section is written by the LLM who described the approach. You can skip over it, and just know “the LLM came up with a way to group like things”.
-
Extract only error lines from each log by filtering to lines containing keywords like
error,fail,timeout,refused,denied,insufficient. This eliminates the noise of normal log output. -
Normalize aggressively by stripping ANSI codes, timestamps, dates, IP addresses, SHA256 hashes, CI-specific namespaces, and job name patterns. Without this, clusters form around “ran on March 17” instead of “connection refused.”
-
Vectorize with TF-IDF using bigrams (1-2 word combinations), then run K-means with cluster count proportional to dataset size (
max(5,
min(40, len(docs) // 30))
). -
Use chi-squared discriminative terms instead of centroid-nearest terms. Standard K-means gives you the terms closest to each cluster centroid, which are often generic (“error”, “failed”, “pod”). Chi-squared testing finds terms that are statistically over-represented in each cluster compared to all other clusters. The difference is dramatic:
- Centroid terms:
step failed, pod failed, time error, error component - Chi-squared terms:
ocp failed, containernotfound, specified container
The second set actually tells you what’s distinctive about the cluster.
- Centroid terms:
-
Integrate clusters into the screener. Each item gets purple cluster terms in the sidebar, and a “View all in cluster” button that filters to just that group.
This let the reviewer think in terms of groups. Instead of “let me look at thousands of unknowns one at a time,” it became “cluster #17 has 71 jobs with terms ‘stricthostkeychecking, userknownhostsfile, connecttimeout’, those are all SSH config failures during install.” One click to view the cluster, confirm a few samples, create the category, and pattern-match the rest.
Some clusters surfaced brand new problems I didn’t know were occuring.
When to Use This Pattern
The Screener Loop works when you have:
- Hundreds to tens of thousands of unstructured artifacts to classify
- Domain expertise that can’t be fully encoded upfront because you know it when you see it, but can’t write all the rules in advance
- Categories that emerge from the data rather than being defined beforehand
It’s particularly effective for incident analysis, log triage, support ticket categorization, and any situation where you’re trying to find patterns in a large corpus of messy text.
Back to posts